
Inflection Point for the Fed: Fixed Income Scenarios
The path for monetary policy over the next year is biased lower as reflected in forward rates. Inflation continues to trend lower, and the labor market is cooling, perhaps more quickly than previously thought. The Fed delivered a 50 bps cut at its policy meeting in September. The official statement indicated that the FOMC is confident with the direction of inflation AND they are sensitive to further deterioration in labor markets. The market reacted strongly to the weak July employment report by rallying and steepening. Although the curve has retraced some of that, the reaction is indicative of the market’s bull steepening bias.
Recession probabilities remain low, but the market is pricing in aggressive policy easing that starts in September and the "hard landing" scenario has re-entered the debate. The largest unknowns are 1) how fast is the economy really slowing down, particularly the labor market and 2) how aggressive will Fed need to be with policy easing. At present, the market is pricing in about 6 rate cuts by the end of 2025.
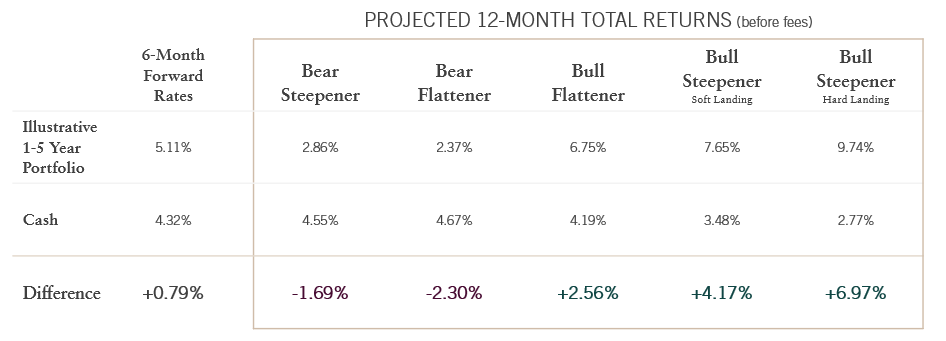
The chart below reflects expected returns in the interest rate scenarios that follow the chart.
As you are likely aware, the Galliard investment process is not one to make interest rate calls. Some of these scenarios are more likely than others, but that said, we work to build flexibility into the portfolios to be able to adjust to changing economic conditions as warranted.
The scenario analysis is for illustrative purposes only and is not meant to be a recommendation or forecast. Note, the returns shown do not utilize the returns of any Galliard strategies. The six-month forward curve is the market implied shape of the curve 6 months in the future based on current market rates. These are the returns that would be realized if the forward curve were to materialize over the horizon. To calculate the scenario returns, the analysis uses the income return from the coupon, rolldown yield, change in rates and a spread of 70 bps. The portfolio is rebalanced monthly. For duration, the analysis uses partial durations of the Bloomberg Government/Credit 1-5 year index.
Date of data: October 10, 2024; Source: Bloomberg Indices.
Note: “Steepener” and “flattener” refer to the relationship between 2-, 5-, 10- and 30-year bonds.